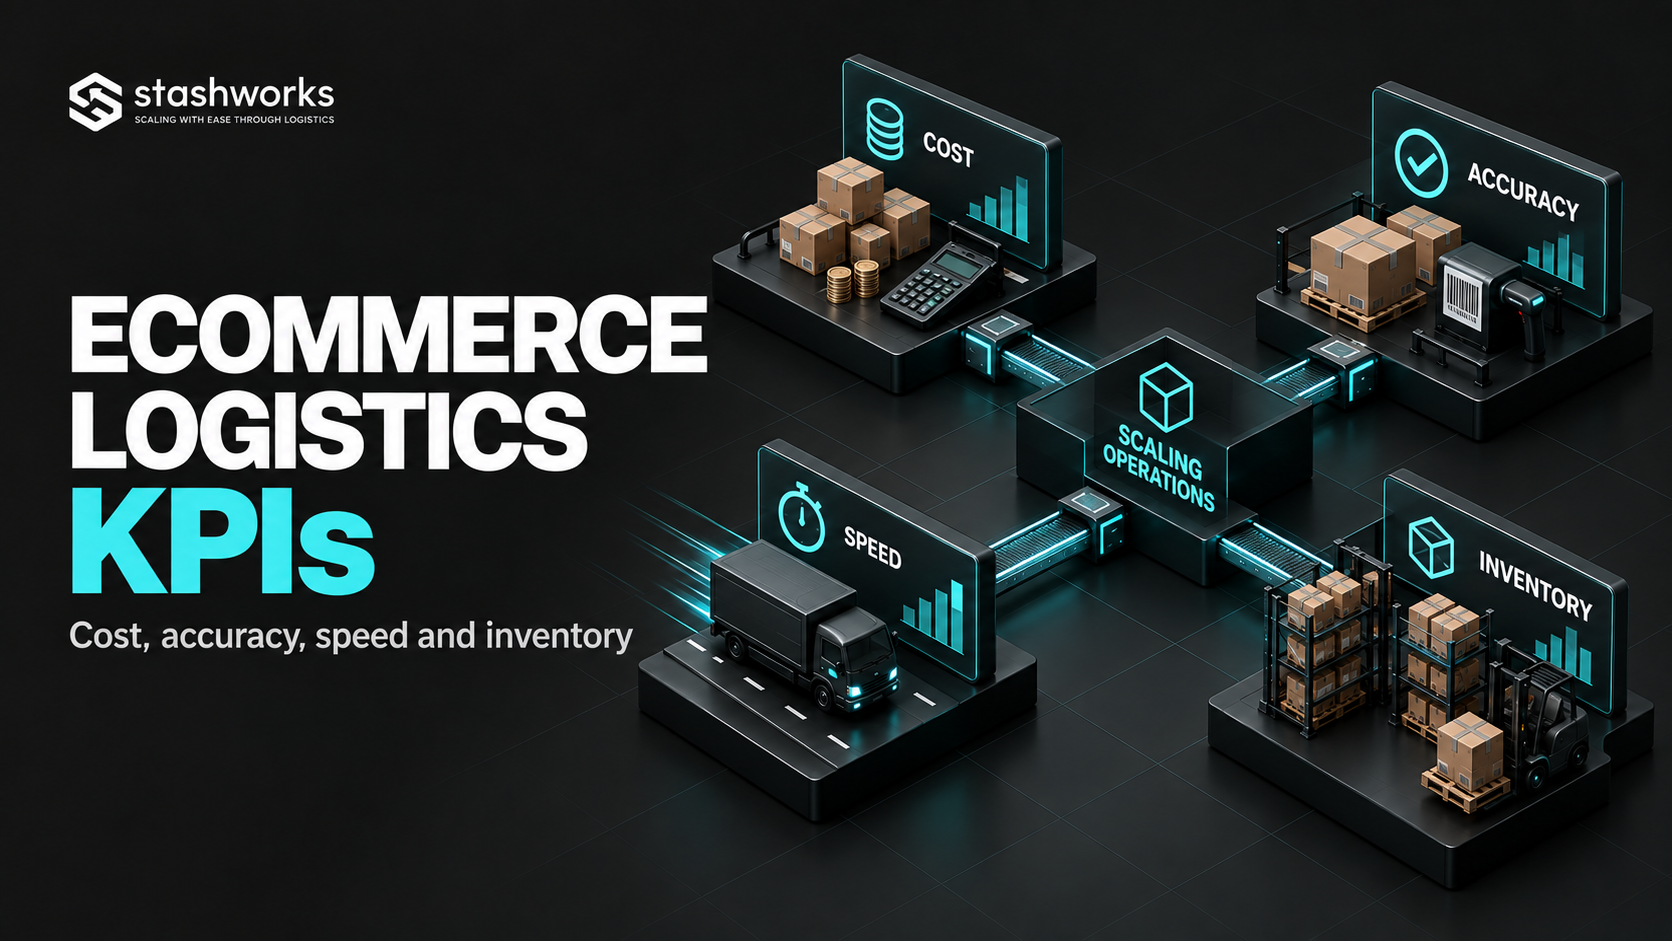
Ecommerce logistics produces a huge amount of data, but a scaling business does not need dozens of metrics. It needs a small scorecard that exposes whether growth is making the operation more expensive, less accurate, slower or harder to keep in stock.
A practical logistics dashboard can be organised around four questions: What does each order cost? Are we shipping the right items? Are orders moving on time? Is inventory trustworthy and productive?
1. Cost per order
Define the scope first. A fulfilment cost-per-order metric might include receiving, storage, pick and pack, packaging and operational fees; a broader logistics cost-per-order metric may also include delivery, freight allocations and returns.
Keep the definition consistent. A number that changes because accounting scope changed is not an operational trend.
2. Order accuracy
Order accuracy measures whether customers received the correct SKU, variant and quantity according to the order.
Track the error reason too: wrong SKU, wrong quantity, missing item, incorrect bundle or packing error. The percentage identifies the problem; the reason code tells the team what to fix.
3. On-time dispatch
Define the internal dispatch target for each service class or marketplace, then measure how many eligible orders are handed to the carrier within that target.
Do not mix orders that were legitimately held for payment, address correction or another upstream exception with orders the warehouse received on time but processed late.
4. Order cycle time
Measure the time from a defined start event, such as order release, to a defined completion event, such as carrier handover. Then break the cycle into release-to-pick, pick-to-pack and pack-to-handover where the systems support it.
A single average can hide one stage that is consistently creating the delay.
5. Dock-to-stock time
Dock-to-stock measures how long incoming inventory takes to move from physical receipt to an available warehouse state.
This matters because a business can technically own inventory that customers still cannot buy. Track receiving exceptions separately so barcode or quantity problems are not hidden inside the average.
6. Inventory accuracy
Inventory accuracy compares the system record with what is physically present. The exact calculation can be unit-based, SKU-based or location-based depending on the warehouse programme.
Define the method before setting a target. Use cycle counts and reconciliation to investigate repeated variance rather than simply overwriting the system quantity.
7. Stockout rate or fill rate
Stockout measures how often demand cannot be served because inventory is unavailable. Fill rate measures the share of demand that can be fulfilled from available stock under the chosen definition.
These measures connect purchasing and inventory planning to customer experience. A warehouse can be fast and accurate while the business still loses sales because replenishment is late.
8. Inventory turnover
Inventory turnover is commonly calculated as cost of goods sold divided by average inventory for the period.
Interpret it by product category and business model. Very high turnover can indicate efficient inventory, but it can also leave too little buffer if replenishment is unreliable.
9. Return rate and fulfilment-error returns
Total return rate is partly a commercial and product metric. Separate the returns caused by logistics errors—wrong item, damaged parcel, missing product or another fulfilment problem—from returns caused by customer preference.
The warehouse should be accountable for the part of the return profile it can actually influence.
10. First-attempt delivery success
For last mile, track how many parcels complete delivery without a reattempt or return-to-sender event. Segment the result by carrier and service type where possible.
This helps the business evaluate the real cost of delivery rather than comparing carrier prices in isolation.
Segment KPIs before averages hide the problem
Break important metrics down by channel, service level, SKU family, warehouse process and campaign period. A healthy monthly average can hide one marketplace with repeated late dispatch or one product family driving most pick errors.
Use exceptions alongside percentages
A dashboard should lead to action. Pair each KPI with an exception queue: late orders, unmatched inventory, receiving discrepancies, failed carrier handovers and unresolved returns.
The operating team needs to know which records require intervention now, not only what last month's average was.
Do not use a KPI without defining its timestamps and scope
“Fulfilment time”, “on time”, “inventory accuracy” and “cost per order” can all be calculated differently. Write the definition next to the metric and keep it stable enough for trend analysis.
Connect the scorecard to the systems that create the events
Stashworks' technology layer is positioned around connected order flow, inventory visibility and warehouse management. When designing a KPI scorecard, confirm which timestamps, inventory states and exception events are available from the actual account configuration.
The goal is not to create the most impressive dashboard. It is to make cost, accuracy, speed and inventory problems visible early enough to fix them before higher order volume magnifies them.
Sources: Shopify, Warehouse Efficiency Metrics; Shopify Enterprise, Operational Metrics; Shopify, Ecommerce KPIs; Stashworks, Technology.